How to uncover the unique brand that sets you apart from all the other honest, hard-working, professional, results-oriented Realtors® out there.
BRANDING
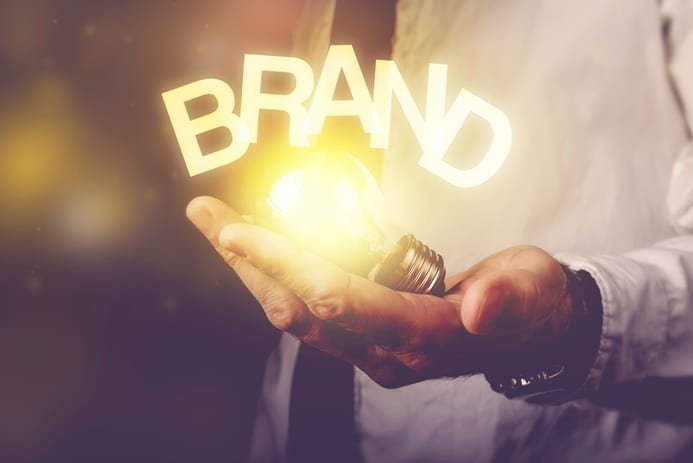
Even if you have never spent a penny on branding you are a brand already.
There’s a lot of confusion about the term “branding.” This list comes from What Language are We Speaking? Understanding the Day-To-Day Jargon of Designers & Printers, care of Unisource Canada, Inc.
A brand promises a result and experience you can count on.
A Brand is intangible – It is the meaning or feelings you associate with a service, company or product. If five people are asked to describe a well-known brand, you may get different descriptions; however, there will be similarities. These similarities are the brand, and they are very powerful.
A Brand is not a logo – A logo only identifies the brand; it is an entry point.
A Brand is not an identity system – An identity system only controls the expression of the brand. Identity systems (often called branding systems) are created to express the brand in a consistent and cost-effective way.
A Brand is not a product – Many people talk about managing their brand, but they really are managing their product. The brand is often the reason we buy the product. People, corporations and countries can have brands.
Read More